The Happy Music Project

I recommend reading this on Firefox or Chrome, on a laptop or the biggest screen you can find.

The Happy Music Project is one that I've been wanting to take on for a really long time. I've attempted it a few times before, only for it to be shelved for some reason. It has been one of my toughest projects so far. So, why did I want to take this on then? Simple - curiosity.

The idea behind the Happy Music Project was to explore what happens when we analyse the data behind the songs that make us happy. What does it tell us about the people that listen to them? Are there differences in musical preferences across age groups, cultures, or cities? Does our taste in music change as we age, or do some songs stay with us throughout our lives? What lyrics really move people? To find answers, I reached out to people from various cities and age groups, asking them to share the songs that make them happiest.

I was also curious to compare my own “happy music” to what others listen to. I've always known I gravitate toward sadder music to feel happy, and I wanted to see if that was a common pattern. My playlist also tends to be all over the place genre-wise, so I was curious if it was the same with other people. Sounds like fun, right? Let's dig in!

What exactly counts as a "happy song"? It’s any song that brings joy, comfort, or that feeling of home, and this could mean that "sad" songs make it to the list too. As long as it brings you joy, makes you feel at home, or just puts you in a better mood, it counts. On a lighter note, I hope this project will introduce you to some new tracks and artists along the way!

Throughout the article you will see boxes like this. I call them nerd-out boxes. Read them if you want more detail but feel free to skip them and they won’t affect the flow of the article.

Some things to keep in mind:

  • All the songs that I received were decoded through Spotify's API that helped me break them down into different data attributes, which you will see later
  • The user sample size is limited to only 22 users, so some of the data I collected was a little limited and isn't super conclusive. It's still brought out some fun trends though.
  • Why only 22 users? Because while I was working on the project, Spotify deprecated a LOT of its data available on their public API. So most of the data I’ve based the project on has become completely unavailable for anyone who’s filled the form later. There was no warning about it so a lot of people like me just got left in the dark and their code not working. Great job, Spotify!
  • The sample data for songs is pretty significant. I received about 1089 songs but since the number of users are less, it is a little biased from a data perspective. More users with less songs would’ve helped reduce the bias.
  • Some users submitted only 20-30 songs, while some submitted 200, so to ensure there’s not too much bias from one user, I’ve limited the set to 100 songs per user.
  • So far none of the attributes in this part of the article take into account the lyrics of the song. This is ALL music focused; lyrics may be tackled in part 2.

Overall Stats

Some overall stats to start this off!

Shortest Song
Speak to Me
Pink Floyd
1:05 mins

2% of the songs submitted are less than
2 mins long

Longest Song
Aap Baithe Hai
Nusrat Fateh Ali Khan
15:41 mins

The second longest song is also by Nusrat Fateh Ali Khan - Kehna Ghalat Ghalat

Oldest Song
Aiye Meherban
Asha Bhosle, R.D. Burman
1958

The song was added by one of the
youngest users

Newest Song
Where Light Can't Reach
Nothingtosay, D0d.
Oct 14, 2024

The song was less than a day old when it was submitted

Welcome to the Jungle

Remember how I said that I used the Spotify API to decode the songs? Let's explore that a little bit, shall we?

In 2005, Tristan Jehan and Ben Whitman founded Echo Nest based on their MIT Media Lab dissertation. Their goal was to understand music's audio content for identification, recommendation, playlist creation, audio fingerprinting, and analysis - serving both consumers and developers. They achieved this by web crawling, data mining, and digital signal processing across 30 million songs!

After Spotify acquired Echo Nest in 2014, it became the foundation of Spotify's stellar recommendations and furthering its market share. Fast forward to November 2024, Spotify shuts down its API, (presumably on my part) to prevent developers and AI trainers from crawling, mining, and analyzing their music data. The irony.

There are around 13 song attributes in total that Spotify provides for each song, but I’ll focus on the key ones for this article. The numbers associated with these attributes aren’t absolute values, but probabilities. For example, if a track scores 0.965 for danceability, it means the algorithm is 96.5% confident that the song is super danceable.

However, for the sake of this article, let’s treat these numbers as absolute. For e.g., a lower value of a track on the danceability scale means that it is less danceable, and similarly so for higher values.

Just a heads-up: take all the data with a pinch of salt, and as you read on, you’ll see exactly why I’m saying this.

Valence

This one's all about happiness. It's the musical positiveness conveyed by a track. Tracks with high valence sound more positive (e.g. happy, cheerful, euphoric), while tracks with low valence sound more somber (e.g. sad, depressed, angry).

Now that you know about Valence, presenting to you the happiest and saddest songs from everyone! Fun fact: 3 of the 5 saddest songs comes from a single user - me.

Happiest Song
September
Earth, Wind & Fire
0.981

2. Chucuchá Ilegales 0.975
3. In the Summertime Mungo Jerry 0.973
4. Chor Bazari Neeraj Shridhar, Sunidhi Chauhan, Pritam 0.973
5. Tauba Tauba Kailash Kher 0.967

Saddest Song
Speak to Me
Pink Floyd
0.0313

2. King of the Golden Hall Howard Shore 0.0346
3. Fly Ludovico Einaudi 0.0347
4. Experience Ludovico Einaudi 0.0360
5. Mountains Hans Zimmer 0.0371

Danceability

This one's self-explanatory. It tells you how easy it is to dance to a track. It’s based on tempo, rhythm, and how much of a groove the song has. Songs with higher danceability tend to have stronger, more regular beats.

Most Danceable Song
Give it to Me
Timbaland
0.975

Least Danceable Song
Gangsta
Kehlani
0.113

Energy

Energy measures how intense or energetic a song is. Higher energy means faster beats, louder sounds, and more intensity - think upbeat pop or rock.

Most Energetic Song
Gimme Chocolate!!
BABYMETAL
0.985

Least Energetic Song
Day One
Hans Zimmer
0.0173

Acousticness

This tells you how “acoustic” or natural a track sounds. High scores indicate less electronic manipulation, more organic instruments, and minimal processing.

Most Acoustic Song
Lorem Ipsum
Pavel Bittová
0.995

Least Acoustic Song
Tron Legacy End Titles
Daft Punk
0.0000131

Tempo

The tempo is the speed of the track, measured in beats per minute (BPM). Faster tempos are more upbeat, while slower tempos are more relaxed.

Highest BPM Song
No Guts No Glory
Cassio Monroe
207.5 BPM

Lowest BPM Song
A Million Dreams
Ziv Zaifman, Michelle Williams
54.75 BPM

Instrumentalness

If a song has little to no vocals, it scores higher here. “Ooh” and “aah” sounds are treated as instrumental in this context. The algorithm looks for vocal-like frequencies and decides whether a track is mostly instrumental based on how much human voice is present. FYI - the most instrumental song here has beat out an actual Bach prelude.

Most Instrumental
Westworld Theme Cover
Sofa Sounds, Ramin Djawadi
0.984

Popularity

How popular the song is on a scale of 0-100 among Spotify users and is calculated from the song’s overall performance on the platform. It’s not just about stream counts, but also includes factors like how many people are listening to the song, how often they’re listening, and how recently they’ve listened to it.

There are about 70 songs with a popularity index of 0, 30% of which are of Indian origin. Surprisingly, even tracks like Starboy, Let Her Go, Photograph, Udd Gaye, Bumbro, and Fanaa have a popularity of 0.

Most Popular Song
Guess
Charli XCX, Billie Eilish
91

Average Song

So if we analyse ALL the songs, what’s the average song in the whole list? A song whose attributes come closest to the average of all attributes?

Avg Song
Tum Jab Paas
Prateek Kuhad

Valence  0.471
Tempo  122 BPM
Acousticness  0.528
Energy  0.344
Danceability  0.751
Popularity  54 Instrumentalness 0.00000162
Speechiness  0.0379
Liveness  0.113

Major Distribution

Let's map out the distribution of songs across the spectrum of each attribute! Higher bars mean more songs fall into that range.

Popularity: Unsurprisingly, the overall trend is leaning towards more popular songs, maybe because popular, catchy songs tend to stick with us and put us in a better mood. Interestingly though, notice the big spike on 0 popularity songs. Looks like everyone is listening to a lot of hidden gems and forgotten songs, which is quite a pleasant surprise. When I dug further, I found out that there is a slight negative bias toward Indian origin songs, which we’ll come to shortly.

Happiness/Valence: This was super interesting. There's a clear trend towards the left, so we seem to be more comforted or happy in listening to mellow or less upbeat tracks, with the peak around 0.5!

Danceability: Interestingly, Danceability is a mirror image of Valence. While Valence trends towards the left half of the spectrum, Danceability is right-heavy, meaning that danceable songs are your jam! This could probably be since Spotify measures Danceability on grooviness & regularity, and Valence on how the chord progression & harmony sounds? So a song could have a strong groove (more danceable) but still have darker harmonies & chord progressions (less happy).

Acousticness: There's a striking trend towards non-acoustic songs, which means that a lot of you enjoy listening to electronic music, and it seems to play a big role in keeping you happy!

Energy: The only one that’s almost fully spread out properly in a bell curve shape! This is also in line with the happiness chart, both sticking out at around 0.5. It means that that particular number on the energy and happiness scale seems to be REALLY soothing to people.

Year of release: This was also very surprising, I was expecting a lot more older songs, but seems like recency bias is playing into this one? The newer the song is, the more you listen to it and the easier you recollect it, I guess? We’ll delve into more of this later.

Duration: These are simpler attributes and so the graphs are self-explanatory

Tempo: These are simpler attributes and so the graphs are self-explanatory

We are the champions

Wouldn't it also be cool to know the artists that make us happy? To get to this, I first just rounded up the artists appearing in most number of tracks overall. Behold!

Taylor Swift 21 songs across 5 albums

Red
exile
willow
evermore
All Too Well
Shake It Off
The Last Time
Wildest Dreams
You Belong With Me
Soon You'll Get Better
loml
Lover
Delicate
End Game
Love Story
I Don't Wanna
Live Forever

Safe & Sound
The Prophecy
So Long London

Taylor coming in for the win! I’d expected this because Swifties are known to be super loyal, and with her recent tour I was expecting a surge of her songs. However, when I dug into the data, I realised 3/5 of these artists had been added by a single user. So the person that likes Taylor or Stromae or Doja Cat, REALLY likes them. FYI - all these people are Gen Z!

A.R. Rahman
21 songs

Pritam
17 songs

Stromae
16 songs

Doja cat
15 songs

I'm the best

This felt like the antithesis of what I was trying to do, which is find an artist that appears ACROSS users and makes more people happy. So to prevent user bias, I considered new filters where a single user's list contributed less than 50% of a particular artist's tracks. Our new top 5:

A.R Rahman 21 songs across 8 users

Ay Hairathe
Aye Udi Udi Udi
Dil Se Re
Kun Faya Kun
Saathiya
Khulke Jeene Ka
Mental Manadhil
O Humdum Suniyo Re
Rehna Tu
Tum Tak
Tere Bina
Urvashi Urvashi
Maahi Ve
Ghanan Ghanan
Naadan Parinde

Pritam
17 songs across
8 users
Ilahi being the most popular track, in 3 people’s list

Arijit Singh
12 songs across
8 users
Ilahi being the most popular track, in 3 people’s list

Alka Yagnik
12 songs across
5 users
Ay Hairathe being the most popular track, in 3 people’s list

Daft Punk
10 songs across
4 users
I feel it coming and Starboy, appearing on 2 people’s list

You are my sunshine

Top song was a clear winner! Mystery of Love by Sufjan Stevens appeared in 4 people’s playlists. This was followed by a whopping 13 songs that appeared in 3 people’s playlists. List alongside.

Top Song
Mystery of Love
Sufjan Stevens
4 appearances

 
Sunflower Post Malone, Swae Lee
The Night We Met Lord Huron
September Earth, Wind & Fire
Ilahi Arijit Singh, Pritam
Aasa Kooda Sai Abhyankkar, Sai Smriti

Nuvole Bianche Ludovico Einaudi
Khalasi Aditya Gadhvi, Achint
Dancing Queen ABBA
Chan Kithan Ali Sethi
Uptown Funk Mark Ronson, Bruno Mars

Ay Hairathe Hariharan, Alka Yagnik, A.R.Rahman
Pehli Baar Sukriti Kakkar, Siddharth Mahadevan, Shankar-Ehsaan-Loy
Patakha Guddi Nooran Sisters, AR Rahman

Golmaal

Before I take you through the world of Genres, there's one hypothesis I would like to put forth, not just about Spotify, but about most other music services, especially when it comes to Indian music. My hypothesis: they’re built for the Western music industry, which just doesn’t translate well to Indian Cinema and its diverse music structure. Let me explain.

First up is Artists.

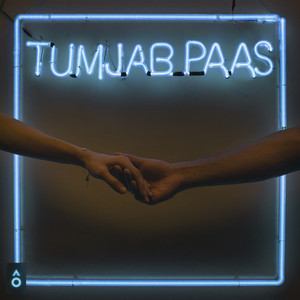
In the Western music industry, artists or bands are usually the ones to get credited, while composers and lyricists often get left out of the limelight. We don’t know who the composer for Beyonce’s Crazy in Love or Coldplay’s Yellow is. Was it them or did they have help? This would also be the same for indie artists from India. Who has composed and written Shaan’s Tanha Dil, or Prateek Kuhad’s Tum Jab Paas? No one knows from Spotify’s data on artists. On all these songs, only the artist or the band is listed.

Crazy in Love was written by Beyonce, Jay-Z, Rich Harrison, and Eugene Record. It was composed by Beyonce, and Rich Harrison.
Yellow was written by Coldplay, and composed by Coldplay and Ken Nelson.
Tanha Dil was composed by Ram Sampath, and was written by Shaan.
Tum Jab Paas was written and composed by Prateek Kuhad

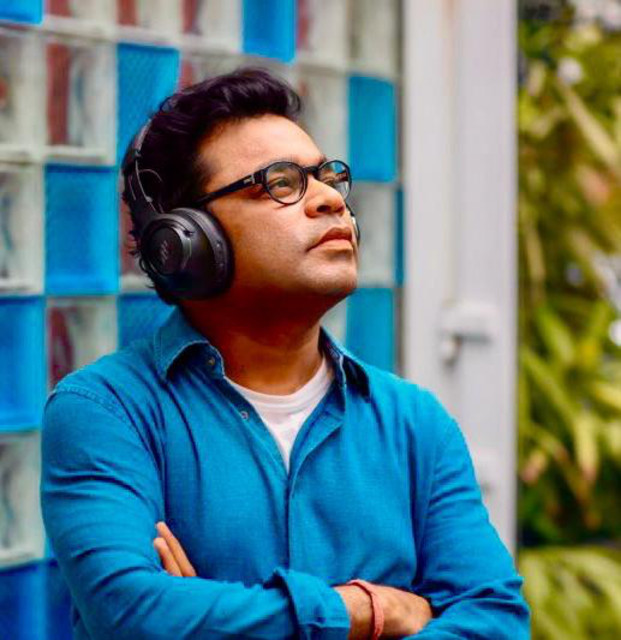
This works well so far (kind of). When you introduce music from Indian Cinema, it starts going haywire. In Indian cinema, each song has a composer(s), lyricist(s), and singer(s). Now on Spotify, things get messy on how they credit artists. Music directors sometimes show up on the credits but sometimes don’t. Same with lyricists. Singers are ALWAYS credited. For example, A.R. Rahman appears as an artist on Saathiya but not on Dil Se, even though he composed both. For Saathiya, A.R. Rahman is credited as an artist on every single song along with the singers. For Dil Se however, he is credited only on one song that he’s sung. Similarly, for Aiye Meherban, R.D. Burman is not listed as an artist, but for Dum Maro Dum, his name appears in the artist billing.

This inconsistency is frustrating with lyricists as well — Gulzar isn’t credited at all on a lot of tracks he wrote, but he’s credited on the entirety of Saathiya. Meanwhile, Apple Music does a better job by crediting Rahman at the album level and listing singers individually, while YouTube Music credits "Various Artists" at an album level but acknowledges the singers for each track.

Now let’s talk Genres.

IT GETS WORSE, and hilarious, but mostly just worse. Spotify tags genres at the artist level, not the song level. Let this sink in for a minute...

THIS. MAKES. NO. SENSE. It works fine for Western artists who tend to stick to a particular genre, but it just about holds true for them. There’s nuance lost there too. For example, Taylor Swift is tagged as “Pop”. That’s it. So all her earlier songs that should be classified as Country or Folk Music, would still be considered as Pop. Bruno Mars is tagged as “Pop” and “Dance Pop”. WUT? Finesse, 24K Magic, Uptown Funk all lose their strong Disco, Reggae, Funk, R&B influences and are lumped in as Pop and Dance Pop instead. Uptown Funk literally has the word funk in its name.

This gets exacerbated in Indian cinema. A.R. Rahman and Shankar-Ehsaan-Loy are both charted under “Filmi” and “Modern Bollywood,” regardless of the diverse genres in their work. Imagine Saadda Haq and Jashn-e-Bahara being tagged the same way - it's music blasphemy — and I don’t even understand genres!

And if you think that’s bad, get this: Udit Narayan is tagged as “Odia Bhajan,” meaning if you listen to him enough, your Discover Weekly is filled with Bhajans. To test this (for science), I actually did this, and it worked.

Spotify's solution to this was to leverage algorithms and data about listening patterns and creating smaller, very niche genres, and attributing these sub-genres to one artist. There’s over 6,000 genres, each weirder than the last. “Vapor Pop” is described as a combination of elements of vaporwave, synthpop, and chillwave. There’s also funk 150 bpm, neo mellow, talent show, shoegaze, bedroom pop, adult standards, and noise pop?! Social media also heavily influences what gets classified. This is how we end up with genres like “Viral Pop,” which exist solely because of data trends on platforms like TikTok. If some of these sound made up, that’s because they are.

While these niche genres attempt to capture some of the nuances of Western music, they often miss the mark with more diverse music from non-Western cultures, especially when applied at an artist level. Leaving everything to data and algorithms doesn’t always yield accurate data.

Glen Macdonald, the former lead data scientist at Spotify that made the niche genres, has also made the “Every Noise” website which uses machine learning to put genres on a spectrum purely using data (tempo, key, harmony, rhythm, and timbre) to cluster similar genres closer together. His approach to music classification relied on analyzing large sets of listening data to identify patterns, like how certain sounds or tempos resonated with listeners.

By using this data, Spotify was able to create new genres or "clusters" that reflected the evolving musical landscape. These clusters often overlapped, allowing for more dynamic and layered categorizations. Genres that were sonically similar were placed close to one another on the map, allowing users to explore how genres like synthwave and vaporwave are related or how genres like soul and R&B compare.

Now, because Spotify has its own genre situation going on, I had to manually map its data back to actual, universal parent genres. A shoutout to Chosic for helping me do that!

Across the universe

Getting back on track (hehe)! Now that we've seen some pretty predictable Artists and not-so-obvious Songs leading the pack, should we see what Genres have in store for us? Once I mapped out all Spotify genres to the parent ones, I wanted to see them all just laid out. This turned out to be such a visual delight that I’m actually thinking of framing it. Pretty simple but beautiful. That’s all of your happiness, represented in one chart :)

Now let’s see how these genres and sub-genres contribute to happy music from everyone. In the chart below, the size and shade of the circles are affected by the number of songs in each genre/sub-genre. The smaller and lighter the circle, the less number of songs it has. Also, this chart is an interctive one, so feel free to click around and explore.

Pop is by far the clear winner with Indian Cinema close behind, followed by Rock. As you can see, while almost all other genres have a lot of sub-genres within them, Indian Cinema is just mainly “Filmi” and “Modern Bollywood” (now you know why I went on about Spotify's random genre clustering). I was expecting Latin to be lot higher than it is, seeing that a lot of the people who participated are latin dancers.

I also wasn’t expecting to see Indie as big as Hip Hop which was a very sweet surprise. Instrumental genres are making a big splash along with the variety of classical genres. New Age came out of the left field for me, I didn’t even know what it was until I started this project.

Blues disappointingly seems to be slept on, but I’m guessing it’s more of a lounge-y genre than something that makes someone happy I guess?

Bittersweet Symphony

This next one is a deep dive into how happiness is split across demographics and genres. If you’re not familiar with violin plots, they’re essentially histograms. We have Valence (the happiness metric) on the Y-axis for all the violin plots. The X-axis has different variables for different plots, like age, gender and individual users. The width of the shape, indicates number of songs, and the colours indicate happy songs, sad songs and everything in between. Yellow means super happy songs, while pink is for sad songs.

People less than 25 seem to have a good distribution between happy and sad songs. First peak around 0.8, the biggest peak coming at 0.4-0.5, and the last one around 0.2.

25-30 year olds just seem to love sad songs! The violin is extremely bottom heavy.

31-35 year olds seem to have the most even distribution throughout, a nice bit of everything with very little variations overall.

People above 35 love the in-between with a long peak between 0.4-0.6.

So to summarise, people less than 25 have just started to adult, listening to a variety of happy, sad, and in between songs. Then you turn 25 and the next 5 years present you with your quarter life crisis - adulting, career, dating, etc and sad songs become your solace. When you turn 30, you realise it's not that bad and everything makes you happy or maybe you’ve just accepted that there’s beauty and happiness in sadness too. After you turn 35 you’re just lingering in between and have found that balance. Sounds about right, right? It’s alright guys, everything's gonna be okay ;) I think. Maybe. Let's move on!


Why are men so sad? Their last peak is around 0.6, whereas the same for women is around 0.8. Women seem to listen to sad music as well but its a little more distributed - even their sadness has diversity. Men on the other hand are concentrated around similar peaks of 0.2 and 0.4.

This was the most interesting one. You can really see which genres are happy and sad! Electronic, Folk/Acoustic, Instrumental and Classical come in with the saddest tracks. Meanwhile, Jazz and Latin seem to be overwhelmingly happy genres. Indian Cinema, Hip hop, and World Folk seems to be trending more towards positivity, whereas Rock, Indie, and Metal seem to tend more toward sad sounding music. Pop and R&B seems to have a decent overall distribution - I honestly did not expect to see R&B in this with Pop. They both have peaks at almost equal intervals of happy, neutral, and sad sounding music.

This is very fascinating so I invite you to take your time and read this one. If you're one of the participants, try and find which one belongs to you :)

Circles

Now that we have genres, let’s split them across user data to see what’s happening!

What I’ve done is basically map out what % of each genre makes up that cluster’s happy music. The size of the circle indicates a higher %.

Pop is ruling everywhere! Seems like people above 35 aren’t that much into Pop, and you can see the steady decline across age groups. Rock seems to be consistent across age groups, but again, people above 35 don’t seem to like it too much. Indian Cinema is super interesting where its showing almost an opposite trend, maybe nostalgia is playing a role? Electronic and R&B seem to be popular with people between 25-35, with people under 25 showing affinity toward Hip hop. People above 35 really seem to be into World Folk, Instrumental, Latin, and Classical music! People between 25-35 seems to have a fondness for New Age music.

The only callout seems to be Rock, with males not preferring it as their happy music. They seem to prefer indian cinema a tad bit more than the women.

This was so much fun to read! Take this with a pinch of salt, because some cities only have 1-2 users. However, people from Trivandrum, Pune, and Turin really seem to be into Indian Cinema, with Kolkata, Goa, Bengaluru not showing too much love for it. Pune seems to be REALLY into World folk, along with Bengaluru and Turin. Kolkata and Goa are also over-indexing on folk/Acoustic music. Bengaluru almost single handedly pulling the weight of Latin music, with Dublin and Turin over indexing on Metal. Kolkata seems to be a city with very diverse musical genres that make them happy.

This is also very fascinating so I invite you to take your time and read this one. If you're one of the participants, try and find which one belongs to you :)

Portrait of a time

Another thing I wanted to test was something I’d read before - “The songs that you listen to in your teens and early 20s are the songs that stick with you for life”. I can’t really prove this, since I don’t know WHEN or at what age someone HEARD the songs that made it to their happy playlist, so I did the next best thing. I charted what age they were when the songs were RELEASED.

So I clustered the age groups and charted what age they were when a song was release. Anything in the negative was before they were born.

We see kind of a very clear pattern. Seems like recency bias does play a role, with it peaking about 5 years before their current age. Let’s dive in.

For people under 25, most songs seems to be added when they were 10-18 years old, with another smaller peak around 22 years. This means on an average, they resonate with songs released 15 years before their current age.

For the 25-30 cluster, we see peak when they were 14-23 years old. Again, about 15 years before their current age.

For people aged 31-35, most of their songs were from when the songs were released when they were 20-34 years old, with the biggest chunk being 28-33 years old. about 10-13 years before their current age.

For the 35+ cluster, the mellow peak is between 24-35, which would amount to 10-13 years before their current age.

So on an average the songs you’ve heard in the last 10-15 years before your current age, influence your happy music A LOT.

Lose Yourself

Here’s a chart that just puts all the songs in one place. Use the genre buttons to filter out songs of that genre. You can also use the search bars on the right to filter by artists, songs, or sub-genres. Reset button clears all filters. Click on the bubbles to get track data, and maybe you’ll discover new music that makes you happy :)


September

Earth, Wind & Fire

Popularity: 83
Duration: 3:36 mins

Genres: R&B, Jazz

Sub-Genres: disco, funk, jazz funk, motown, soul

Year of Release: 1978
Valence: 0.981
Tempo: 126 BPM
Danceability: 0.674
Energy: 0.832
Speechiness: 0.0308
Acousticness: 0.146
Instrumentalness: 0.00000506

The Final Countdown

This has been quite the journey! I also wanted to add a few things before we end. Apart from these interesting data cuts, what can we take back? I did some research around music that people listen to and how they react to it, w.r.t to sad and happy music, because I wanted to find why people like listening to sad music so much, and why does it make them happy?

I looked at two papers; A paper titled “Effects of Sad and Happy Music on Mind-Wandering and the Default Mode Network” written by Liila Taruffi, Corinna Pehrs, Stavros Skouras, and Stefan Koelsch and “The appeal of sad music: A brief overview of current directions in research on motivations for listening to sad music” by Annemieke J.M. van den Tolare - both very fascinating.

What they found is that happy music makes you focus on the song, you connect more strongly and engage with the song itself. Sad music on the other hand, encourages and actively makes your mind wander while the song itself becomes a background score. What they observed is that while listening to sad music, even if the trigger itself was a negative event, the people they tested didn’t focus on everyday negative experiences or past negative thoughts, but more on introspection and looking inward, leading them to a pleasurable affective state.

This is also why listening to sad songs helps you focus on something, because it recedes to the background and your brain takes over. It helps you introspect really well and feel things that you’ve otherwise sidelined. So, in summary while happy songs make you engage with the song itself, sad songs make you engage with you and your being.

Thank you for the music

I hope you enjoyed reading this article. I just want to take a moment to say a huge thank you to everyone who submitted their data to this project, without which none of this would have been possible. Every single contribution means the world to me, and I’m so grateful for your help in bringing this crazy idea to life. You've all made this journey so much more exciting, and I can't thank you enough for diving into the madness of my projects with me.

As a small token of my appreciation, I wanted to give something back. So, I created a few things that I hope you'll enjoy. First up is the chart below. It’s personal to you — each one is unique, like a fingerprint.

If you haven’t seen Inside Out, feel free to skip ahead to the next paragraph, but if you have, you’ll recognize the inspiration behind this idea.

At the end of the movie, there’s this beautiful moment with the orbs, where the emotions are layered together to create a unique, personal experience. That's kind of what I've done here.

Each song you submitted is mapped as a shape, and the chart is made up of all those shapes layered on top of each other. Each of the 5 spokes represents a different musical attribute: Acousticness, Instrumentalness, Energy, Danceability, and Valence. Valence represents the happiness of the track, and I’ve color-coded it so you can easily see which tracks are sadder (blue) and which ones are happier (yellow).

When you look at your chart, you’re seeing a visual representation of what your music happiness looks like. Pretty cool, right?

I didn’t stop there — I also made a custom page just for you. It’s essentially everything you see above, but it’s all charted with your own data. A little thank you gift from me to you! If you’ve submitted your data, DM me, and I’ll let you know which shape is yours and give you a custom URL for your page so you can check it out. Thank you from the bottom of my heart.

Oh! I almost forgot. In an attempt to help you explore more music, I've also made a playlist of all the songs across users that formed part of The Happy Music Project. Keep listening, and keep enjoying the music that makes you happy!